

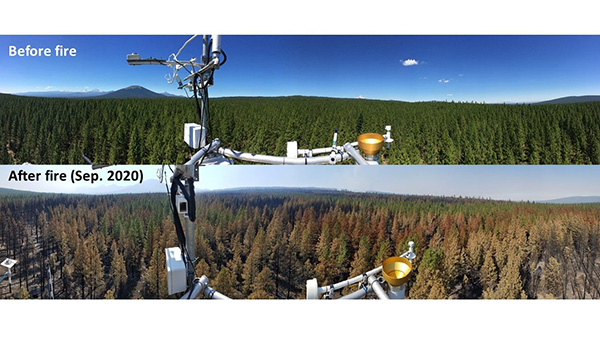
 AmeriFlux Management Project
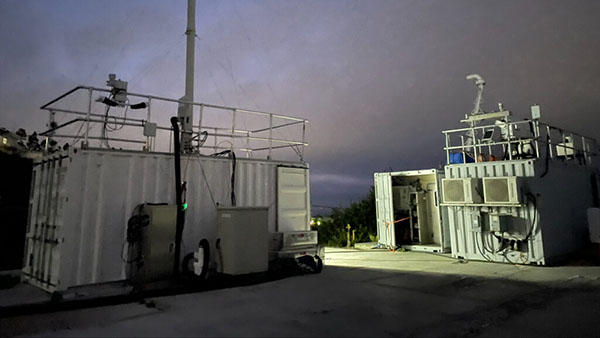
 ARM Data Center
 ARM Translator Group
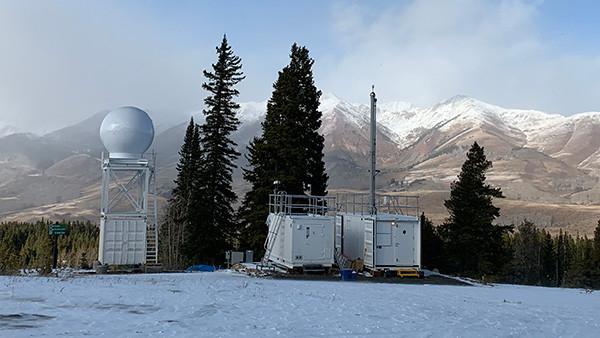
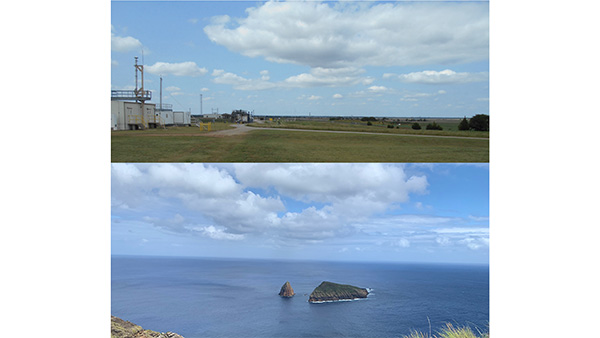
 Atmospheric Radiation Measurement (ARM) User Facility
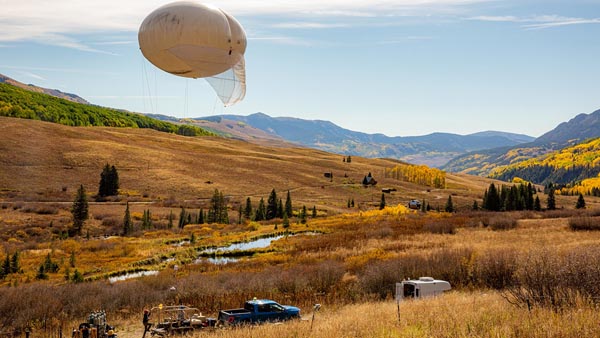
 Characterization of the Aerobiome during the SAIL Campaign
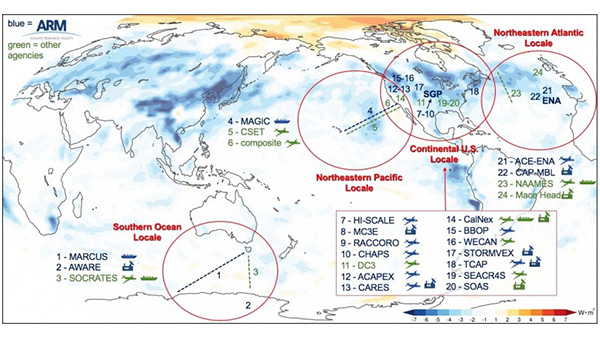
 Cloud Processing of Carbonaceous and Supermicron Aerosol
 EAGLES: Enabling Aerosol-cloud interactions at GLobal convection-permitting scalES
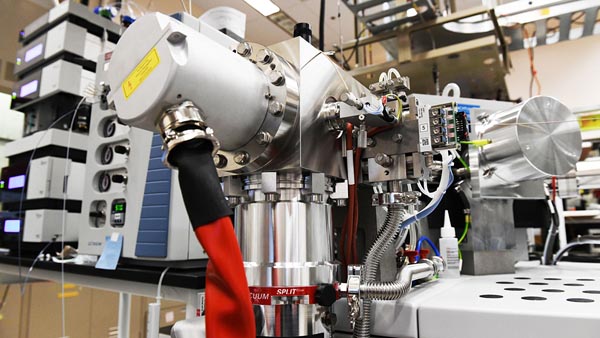 EMSL: Environmental Molecular Sciences Laboratory
 ESGF2: Earth System Grid Federation 2
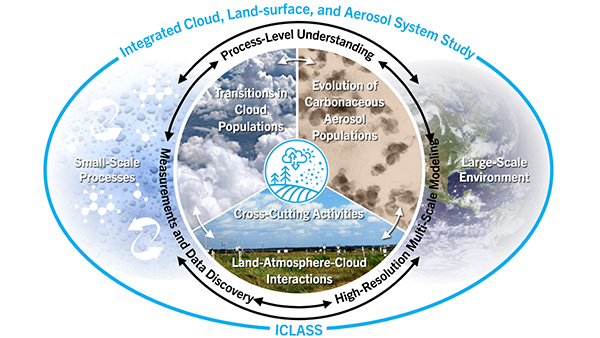 ICLASS: Integrated Cloud, Land-surface, and Aerosol System Study
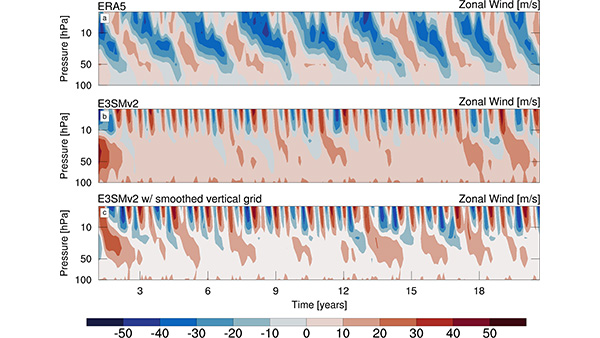 Improving the Quasi-Biennial Oscillation (QBO) through Surrogate - Accelerated Parameter Optimization and Vertical Grid Modification
 Multiscale Models to Advance the Understanding of Liquid-Phase Cloud Response to Aerosol Perturbation Over Ocean and Land with ARM Data
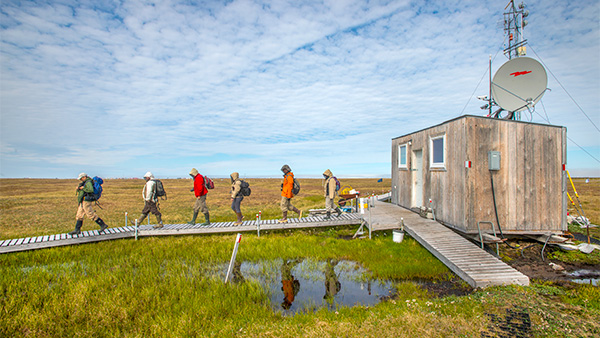 NGEE Arctic: Next Generation Ecosystem Experiments - Arctic
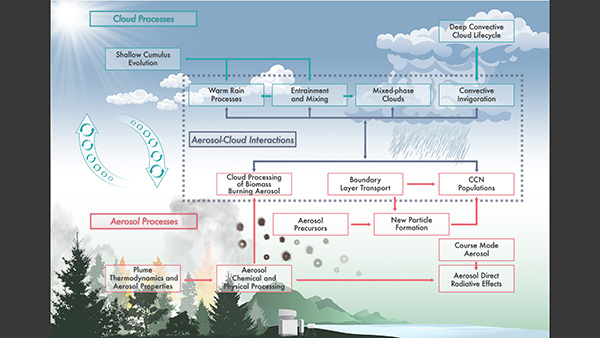 PASCCALS: Process-Level Advancements of Climate through Cloud and Aerosol Lifecycle Studies
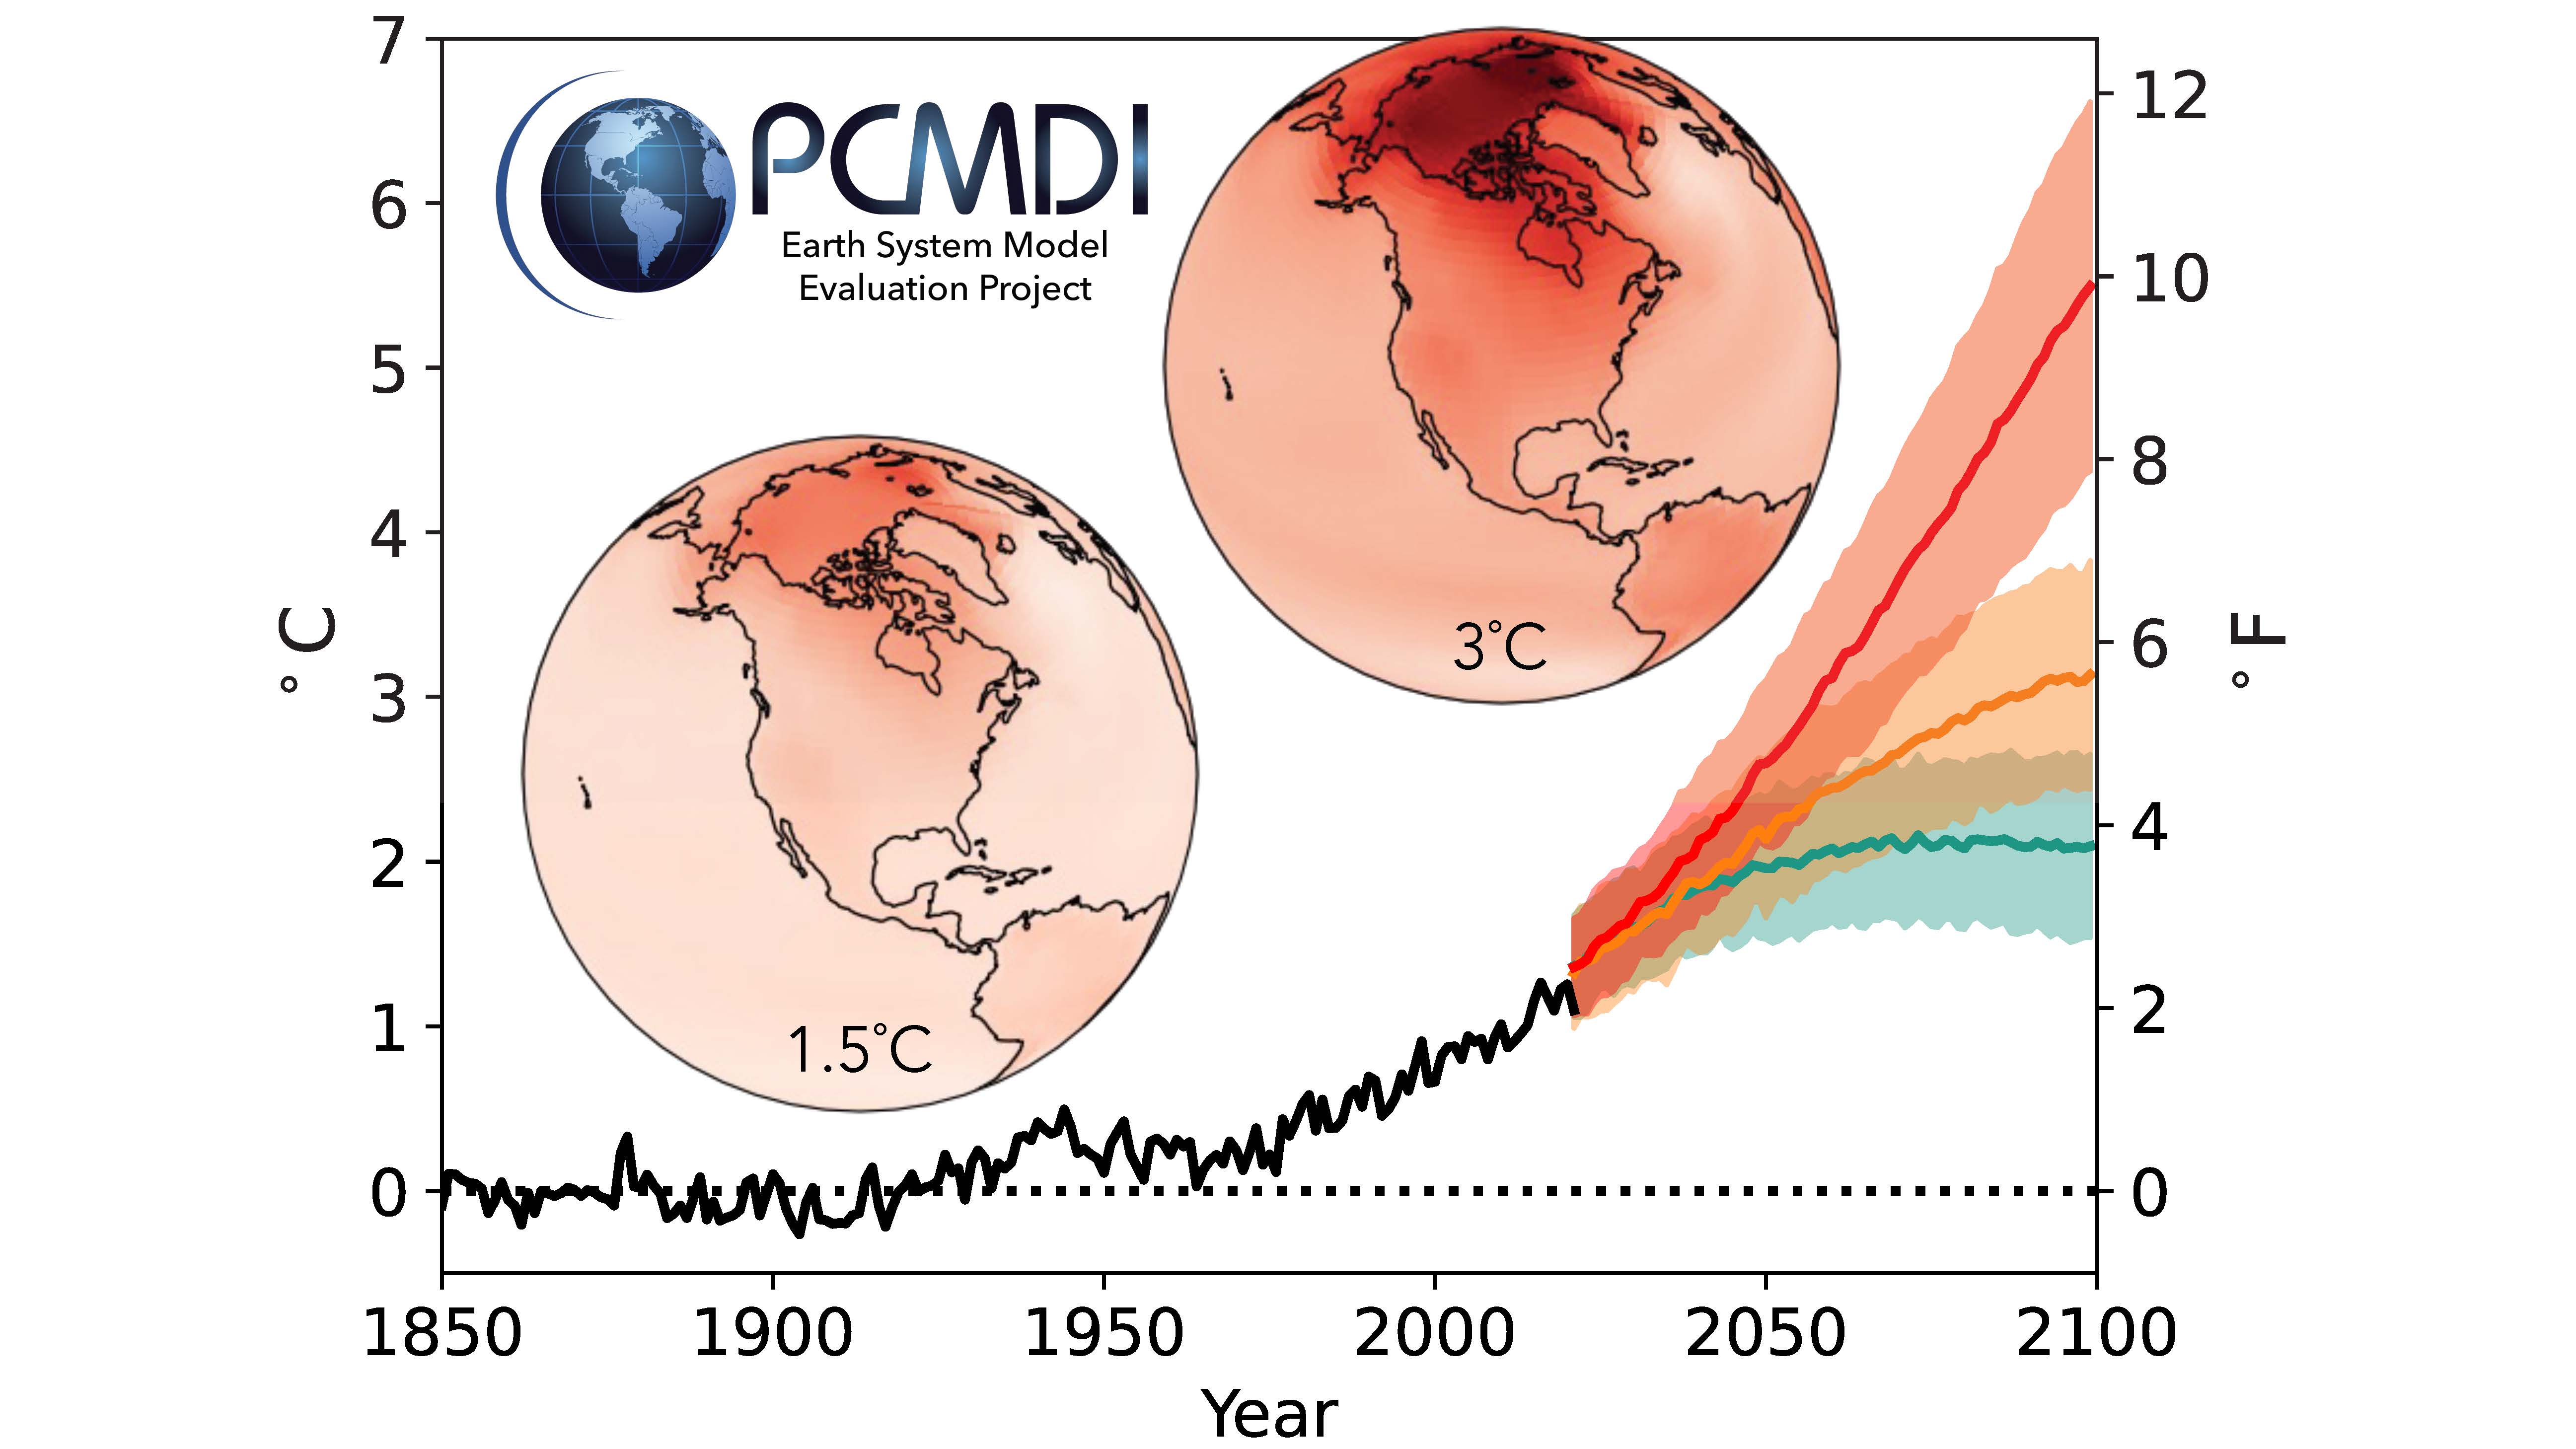 PCMDI: Program for Climate Model Diagnosis and Intercomparison
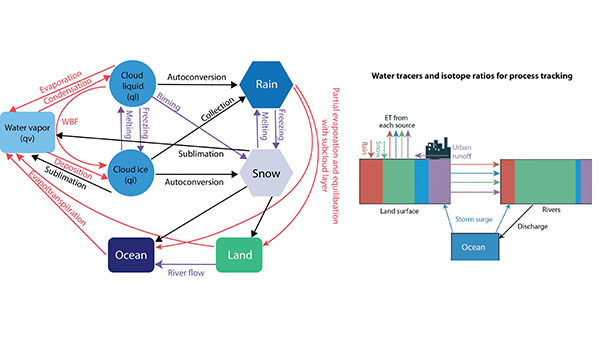 Probing Water Cycle Processes and Extremes in Coastal and Urban Environments Using Water Isotope Ratio Tracers and Numerical Tags
 RUBISCO: Reducing Uncertainties in Biogeochemical Interactions through Synthesis and Computation
 SETx: Equitable solutions for communities caught between floods and air pollution
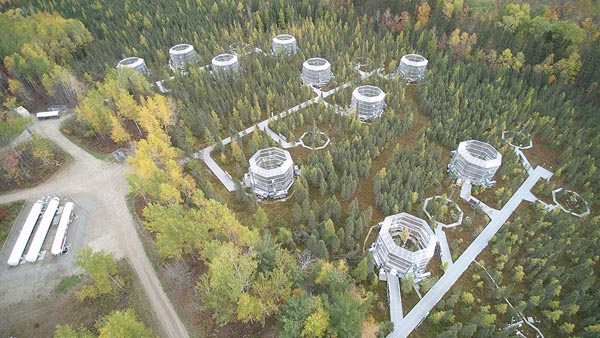 SPRUCE: Spruce and Peatland Responses Under Changing Environments
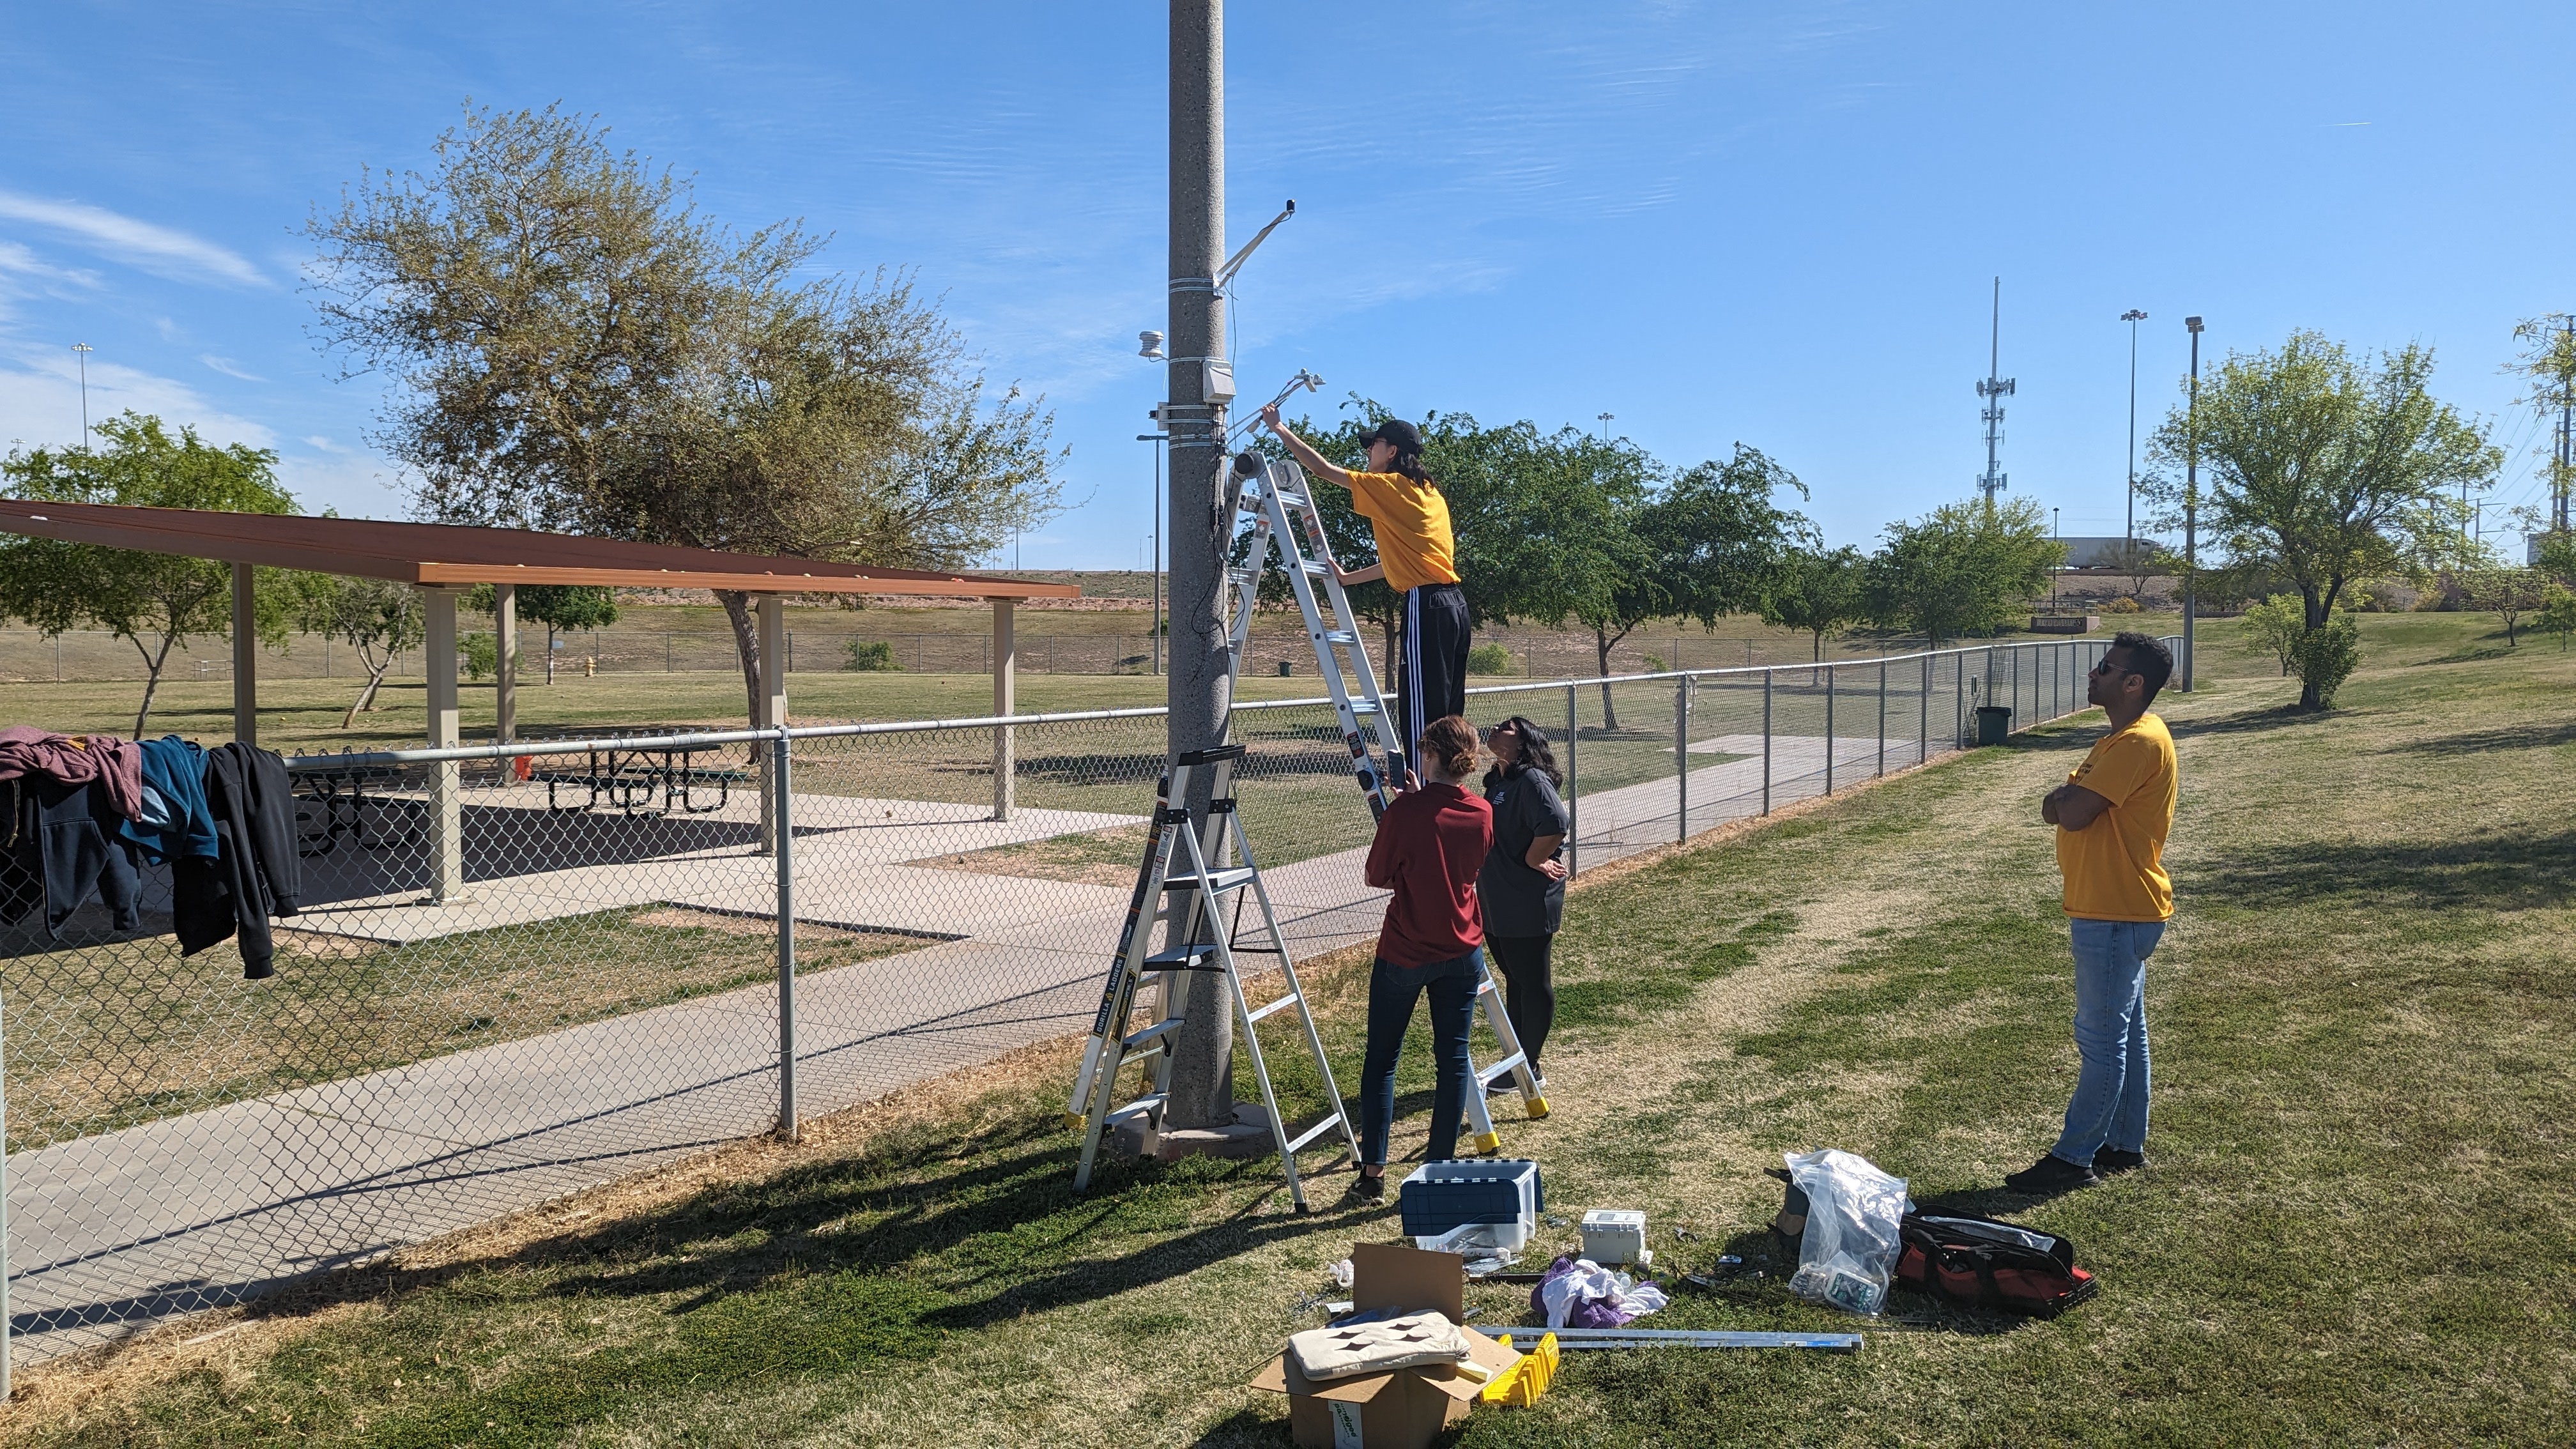 SW-IFL: Southwest Urban Corridor Integrated Field Laboratory